






The Anatomy of an Infographic: 6 Essential Elements

An infographic can make a complicated idea click. It can also turn a perfectly understandable idea into a very long image nobody wants to read.
The difference starts before anyone opens a design file.
Good infographic design gives readers a clear takeaway and a visual path to understanding it. Every chart, label, and illustration should earn its place by helping explain something. Looking impressive in a presentation is a bonus.
Whether you’re describing a process, comparing options, or sharing research, these six elements of an infographic will help you give your audience something useful.
What is an infographic?
An infographic combines text and graphic elements to explain information. It can show how a process works, make comparisons easier to follow, or reveal patterns in data.
It doesn’t have to include statistics. A diagram showing how a product works can be just as useful as a graphic built around survey findings. The format has to follow the question you’re answering.
Before you brief one, finish this sentence: “After seeing this, our audience should understand ______.” If the answer includes five unrelated ideas, you probably have more than one infographic on your hands.
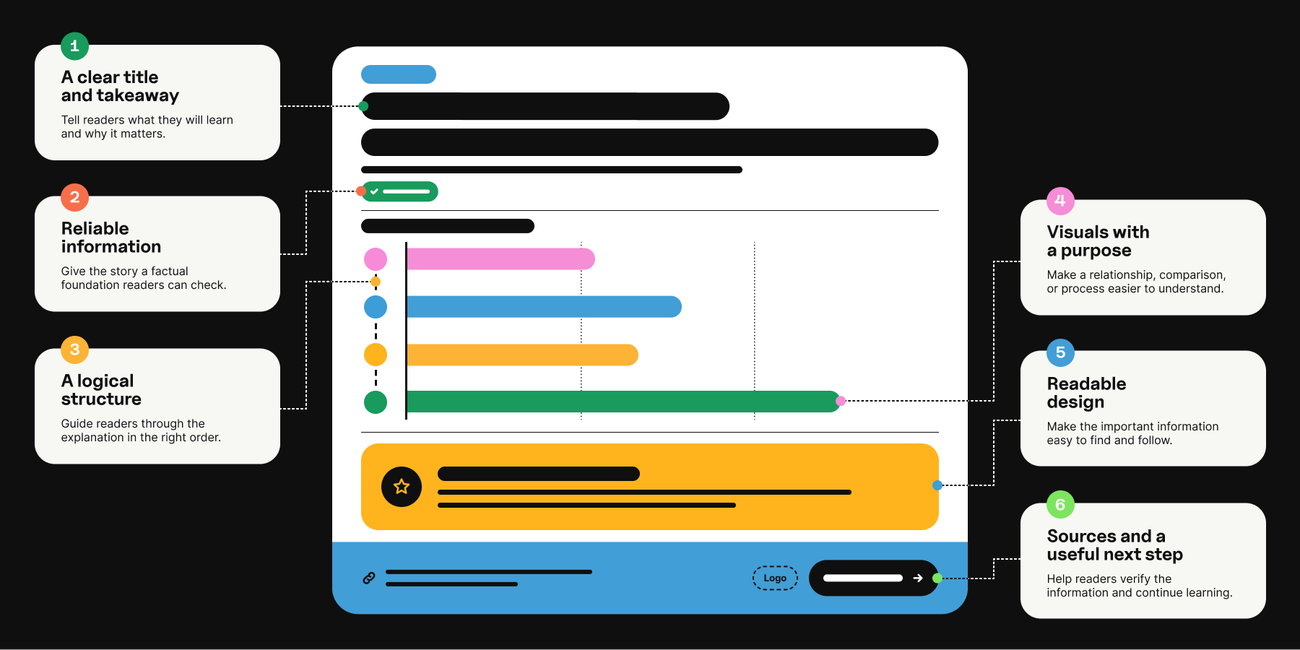
The anatomy of an infographic at a glance
| Element | What it should do |
|---|---|
A clear title and takeaway | Tell readers what they will learn and why it matters. |
Reliable information | Give the story a factual foundation readers can check. |
A logical structure | Guide readers through the explanation in the right order. |
Visuals with a purpose | Make a relationship, comparison, or process easier to understand. |
Readable design | Make the important information easy to find and follow. |
Sources and a useful next step | Help readers verify the information and continue learning. |
1. Give readers a clear title and takeaway
Your title should tell people what the infographic explains. Specificity gives them a reason to keep looking.
“Customer Onboarding” names a topic. “Where Customer Onboarding Gets Stuck” sets up a problem worth investigating.
For a hypothetical onboarding infographic, the central takeaway might be that delays happen between teams, rather than during individual tasks. That gives the content a focus: show the handoffs, explain where work stalls, and identify what readers should examine.
Write the takeaway before collecting every interesting fact you can find. Otherwise, you risk building a scrapbook with a headline.
Subheads should move the explanation forward, too. Labels such as “The handoff,” “The delay,” and “The fix” tell readers how each section contributes to the story. A clever phrase can work, as long as people can still tell what the section means.
2. Build the story on information you can defend
A big number can attract attention. It also needs to hold up when someone asks where it came from.
Start with evidence that answers your audience’s question. Depending on the topic, that could include original research, documented process steps, expert input, or data from a credible primary source.
Before using a statistic, check:
• What was measured, and how was it defined?
• Who or what does the finding describe?
• When was the information collected?
• Does the source support the claim you want to make?
Those details matter. A survey of enterprise technology buyers doesn’t automatically describe every consumer. A percentage without its base can leave readers guessing about the size of the problem.
For our onboarding example, interview the teams involved and check the workflow before illustrating it. If you have verified timing data, show it; if you don’t, explain the sequence without inventing numbers to make the design look more substantial.
And if the evidence doesn’t support the headline, change the headline. The chart shouldn’t have to perform gymnastics to make your point.
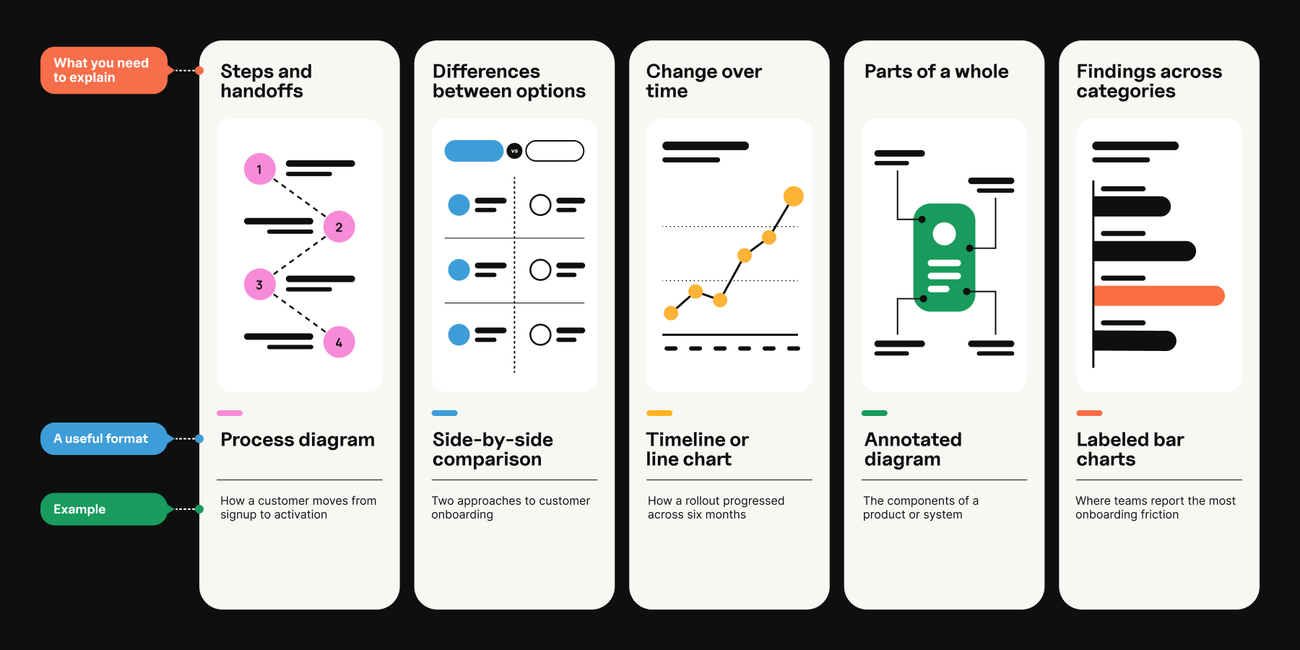
3. Choose a structure that fits the explanation
Different types of infographics solve different communication problems. Choose an infographic layout based on what readers need to understand, rather than whichever template has the nicest colors.
| What you need to explain | A useful format | Example |
|---|---|---|
Steps and handoffs | Process diagram | How a customer moves from signup to activation |
Differences between options | Side-by-side comparison | Two approaches to customer onboarding |
Change over time | Timeline or line chart | How a rollout progressed across six months |
Parts of a whole | Annotated diagram | The components of a product or system |
Findings across categories | Labeled bar charts | Where teams report the most onboarding friction |
The onboarding story would suit a process diagram because the relationships between stages matter. If your question were which stage takes the longest, a bar chart could be the clearer choice.
If you’re figuring out how to make an infographic, outline the content before choosing a template. Give each section one job and put related ideas together. Readers shouldn’t have to guess which label belongs to which chart. A layout with six attractive boxes still needs a reason to connect them.
You don’t need to fit the entire research project into one graphic. You need enough information to make the takeaway understandable and credible.
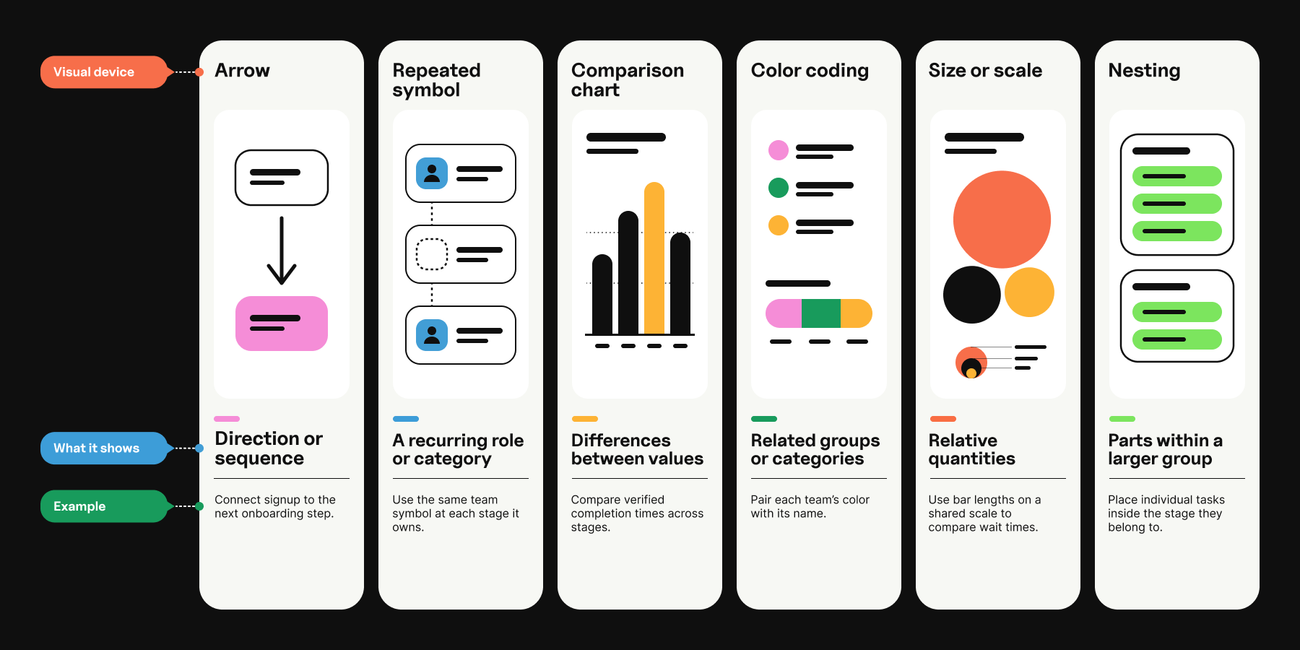
4. Make every visual explain something
Good graphic design makes relationships visible. Charts, icons, and illustrations should help readers see what the words alone make harder to grasp. That’s what makes visual storytelling useful: the design helps carry the explanation.
Choose a visual device that makes the relationship clear:
| Visual device | What it shows | Example |
|---|---|---|
Repeated symbol | A recurring role or category | Use the same team symbol at each stage it owns. |
Comparison chart | Differences between values | Compare verified completion times across stages. |
Color coding | Related groups or categories | Pair each team’s color with its name. |
Size or scale | Relative quantities | Use bar lengths on a shared scale to compare wait times. |
Nesting | Parts within a larger group | Place individual tasks inside the stage they belong to. |
For the onboarding example, use consistent symbols for each team and clearly mark the transfer points. A decorative handshake won’t explain why a handoff fails. A label showing who sends what to whom might.
Keep data displays honest by:
• Labeling units.
• Making time periods clear.
• Using consistent scales when comparing similar charts.
• Starting the value axis in bar charts at zero so bar lengths represent the values fairly.
• Avoiding visual effects that make the numbers harder to judge, such as unnecessary 3D shapes or icons resized in ways that exaggerate differences.
A useful editing question: if we remove this visual, does the explanation become harder to understand? If nothing changes, it may just be taking up space.
5. Design for the size people will actually see
Your designer’s monitor is not the final destination.
An infographic that looks spacious on a large screen can become a wall of tiny text in a mobile feed. Review it at the size readers will encounter it, including on the page where you plan to publish it.
Make the design easy to scan:
• Create a clear hierarchy. Make the headline, section labels, and supporting detail visibly distinct. Style headings of equal importance consistently.
• Give related ideas room. Leave space between groups so readers can tell what belongs together.
• Use color consistently. Keep sufficient contrast and pair meaningful colors with labels or other cues.
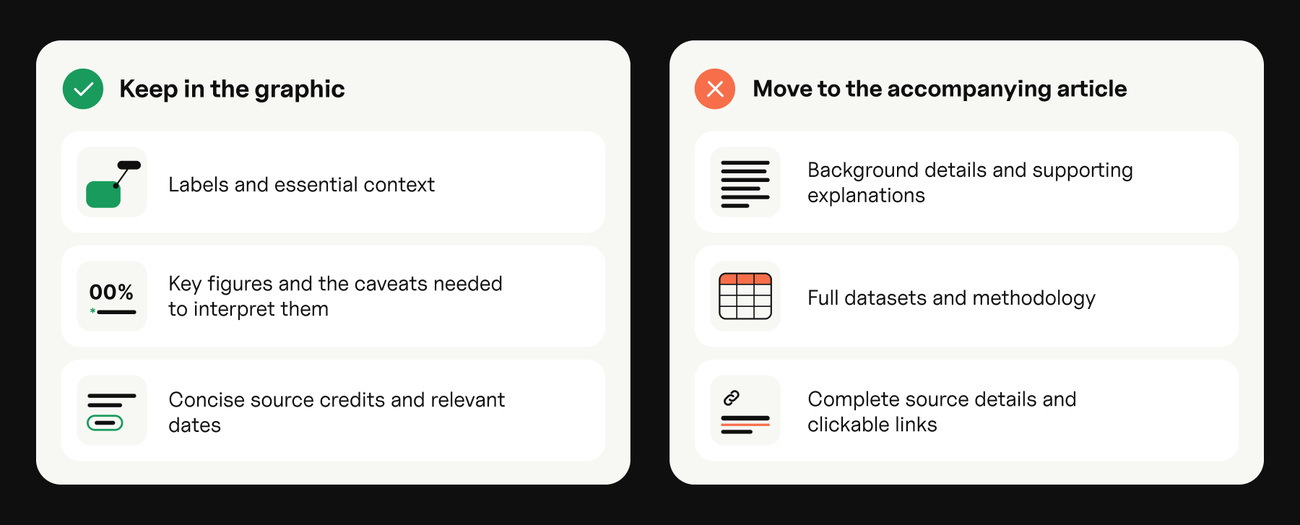
How much text should an infographic have? Enough to explain the point accurately at the intended display size.
| Keep in the graphic | Move to the accompanying article |
|---|---|
Labels and essential context | Background details and supporting explanations |
Key figures and the caveats needed to interpret them | Full datasets and methodology |
Concise source credits and relevant dates | Complete source details and clickable links |
If every section needs two paragraphs, revisit the scope. Smaller type won’t make the story simpler.
You’ll also want to:
• Push back on added copy. When reviewers ask to add more copy, ask what it helps readers understand. Add essential context, but give supporting detail a home outside the graphic.
• Make it fully accessible. Readable type isn’t enough. W3C recommends giving complex images a short text alternative and a fuller description that conveys their essential information. That fuller explanation might be nearby page text, a structured list, or a data table.
Our onboarding diagram could sit alongside a written walkthrough naming each stage, its owner, and the handoff. Readers should be able to get the essential information even when they can’t see the graphic.
6. Include sources and a useful next step
Make it easy for readers to trace the claims. Include concise source details in the graphic and provide clickable links on the accompanying page. Add relevant dates and enough context to distinguish your own findings from third-party research.
Your branding should help people identify who created the resource without overpowering the explanation. A logo doesn’t need to compete with the main finding.
Then consider what someone would reasonably want to do next. For example:
• An infographic about onboarding bottlenecks might lead to a workflow checklist.
• A research summary could link to the full report and methodology.
• A product explainer might point to a relevant demonstration.
Match the next step to the content. Someone learning the basics may be more interested in a practical guide than a sales conversation.
Give your infographic a home beyond the image
Publish the infographic on a relevant page with a clear introduction, its main findings in text, and links to the supporting evidence.
Google’s image guidance recommends descriptive filenames and alt text, relevant surrounding content, and attention to image quality and loading speed. Give the file a meaningful name and place it near the text it illustrates.
Plan distribution while you’re briefing the asset. A process diagram might also become a presentation slide, a sales resource, or a series of social graphics. Adapt each version so it makes sense on its own, and keep the context and source details attached.
Uploading the same towering image everywhere is technically distribution. It’s also a good way to make everyone squint.
Infographic best practices to check before you publish
• Can someone explain the main takeaway after a quick look?
• Does every claim match its source?
• Are comparisons, labels, units, and dates clear?
• Can readers follow the intended order?
• Is the text readable at the intended display size?
• Is the essential information also available as accessible text?
• Does the next step help the reader continue?
Give the draft to someone who hasn’t worked on it. Ask what it’s about, where they started reading, and what they learned. If they can’t find the point or follow the sequence, revisit the hierarchy. Their answers will tell you more than “looks great.”
Make your next infographic worth a closer look
The strongest infographic starts with something worth explaining. Design gives that idea a shape people can understand, use, and share.
Terra brings content strategy and design together to help brands make complex subjects clear. If you have a story buried in a report, a process that needs explaining, or research that deserves more attention, we can help you turn it into useful visual content.
Let’s give your audience something worth looking at.
Related Insights


We’re looking forward to working with you, too.
Start conquering the digital terrain today.